Click to open pdf
Happy New Year and welcome to the first 2016 installment of the Broadband Outreach Center’s Map of the Month series.
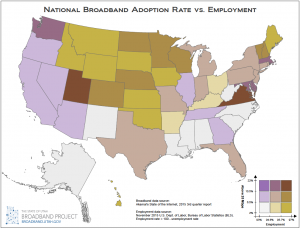
This month we’ve mashed up two state-by-state level datasets that, together, show relationships between access of high speed Internet and overall employment rates. The map color codes each state into one of nine classes, each of which considers broadband and employment rates together.
While there is no perfect correlation between high speed Internet access and employment rates, several interesting observations can be made. First and foremost, Utah and Virginia are the only two states with decidedly higher scores in both high speed access and employment. Colorado and Washington are the two other states that stand out in the western US. Interesting spatial patterns also include the consistency in the upper midwestern states and the lower combined numbers that are found predominantly in southeastern states.
The broadband data was sourced from the Akamai State of the Internet 2015 3rd Quarter Report (Thanks to Akamai for generously providing us with access to the source dataset used for the report). The employment data is from the November 2015 U.S. Dept. of Labor, Bureau of Labor Statistics (BLS), and was created by subtracting the reported, seasonally adjusted unemployment rate from 100%. A state by state graph is shown below and the raw data, including additional access rate thresholds, is accessible via google spreadsheet.

Click to enlarge