The second installment in our new Map of the Month series…
Phase 1 of the FCC’s Mobility Fund reverse auction “will provide one-time support to accelerate our nation’s ongoing efforts to close gaps in mobile wireless service.” The FCC will soon seek bids for providing 3G equivalent broadband service to pre-determined unserved areas of the country. The funding for this reverse auction comes from USF funding voluntarily relinquished by several providers.
The eligible areas for the reverse auction are represented by a set of census blocks for each state that is downloadable in .xls and .shp files from FCC website. The FCC has also published an interactive map that allows users to view the Phase 1 Mobility Fund Eligible Areas and to access the total unserved population and the total unserved road mileage by county. These figures were derived using geographic analysis techniques together with mobile broadband service areas compiled from the National Broadband Map and other data sources, the 2010 Census Blocks, and the 2010 Census TIGER roads data. This basic data may help providers as they consider where they might propose to expand their service and what the costs and benefits are likely to be.
For its May 2012 Broadband Map of the Month series, the Utah Broadband Project (UBP) used a few of Utah’s rich geographic data resources to take a more detailed look at the Mobility Fund Eligible Areas. Three maps were created.
Population
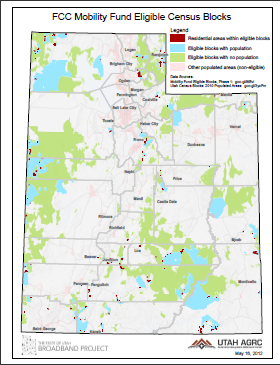
 The first map is a more in depth look at how Utah’s populated areas related to the eligible census block areas. On this map, green areas are unpopulated census blocks eligible for the reverse auction. The blue areas are those mobility fund-eligible blocks with some residential population, and the dark red areas are the approximate boundaries of the populated areas within these populated blocks. As census blocks can be very large in unpopulated areas, the UBP, using statewide 2009 aerial photography, developed its own map dataset to represent the populated areas of rural Utah with more precision.
Transportation
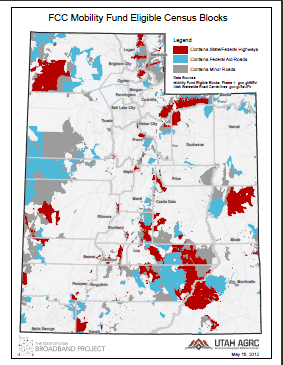
 The second map examines the relative importance each of the eligible areas contributes to the transportation system. Census Blocks containing a section of a state or federal highway are colored red. Those containing a federal-aid eligible roads (a.k.a. ‘County B roads’, which have at minimum, an improved road surface and drainage) are colored blue. These roads are often the main thouroughfare in rural parts of the state. All other eligible areas, which are likely to contain one or more minor roads, are colored gray.
Irrigated Agriculture
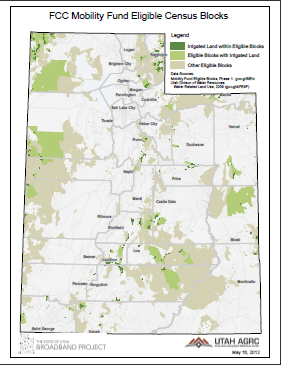
 Population and roads are great surrogates for the mobile broadband service areas demanded by consumers, public safety, and industry. A third demand component not well-represented in the first two maps is irrigated agriculture. Irrigation systems, including sprinklers, diversion gates, and moisture sensors, can all be integrated for optimum performance using mobile broadband. The third map shows the eligible census blocks containing irrigated land (light green) as reported by the Utah Division of Water Resources and the specific areas within those blocks (dark green) where the irrigation occurs. For the purposes of this map, all above ground irrigation technologies, from simple gravity flow surface irrigation to complex center pivot systems, are counted.
Note regarding the GIS data:
The GIS data depicting the eligible blocks and their characteristics, used to create all three maps, is contained in a downloadable zipped .shp file. Those who do not have GIS software should be able to access a spreadsheet of Utah’s Mobility Fund eligible census blocks, with the attribute codes used to color the maps described above, by opening the .dbf file contained in the zip file with Microsoft Excel or equivalent software.
Utah Water Related Land Use and Utah Statewide Roads GIS data are available from gis.utah.gov.