
 One of the important objectives of the Utah Broadband Project (UBP) has been to definitively portray Utah’s Broadband landscape. Gone are the days, thankfully, when discussions around broadband policy couldn’t get off the ground because the coverage, speed and technologies facts could not be agreed upon. The NTIA broadband mapping grant to states, and the accompanying data model, standardized the data gathering process across the country. The Utah Broadband Interactive Map and later, it’s counterpart, the National Broadband Map (NBM), use the same provider-sourced, state-compiled data to greatly improve capabilities for viewing and analyzing the broadband landscape.
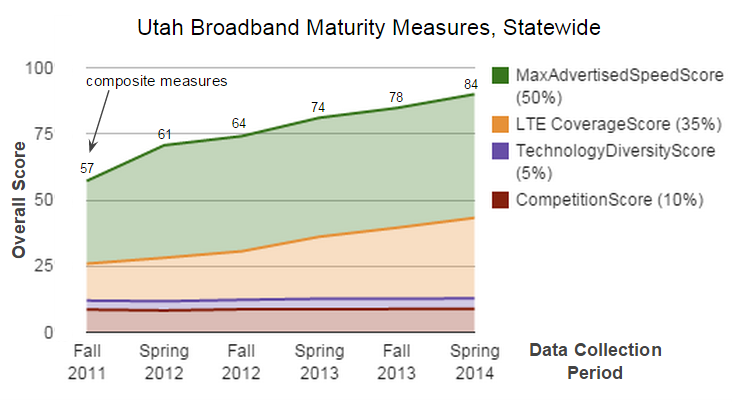
So now that we are nearing the end of the NTIA grant period, which ends Jan 31, 2015, it’s useful to ask, “Where Are We Now?“, “How Far Have We Come?” and “What Still Needs Improvement?” This “Map” of the Month is a misnomer, because it’s actually a graph. We’ve organized broadband coverage, speed, and technology data statistics in order to allow for the construction of meaningful broadband summary metrics for the state as a whole. The data analyzed covers semi-annual data collections from Round 4 (Fall of 2011 which included the first appearance of LTE mobile broadband in Utah) through Round 9 (Spring of 2014). The latest data collection, Round 10, is currently being analyzed and should be available next month.
First Step: Organize the Relevant Data. The FCC, through the NBM’s developer API, makes available broadband summary statistics for each round of NTIA-formatted broadband data that States have collected. Using the API, coverage counts, by population and household, can be requested for specific geographies, including states and counties. In order to build meaningful broadband maturity metrics, the UBP used the NBM API for each data collection round published to date. Additional analysis was performed specifically for LTE coverage, measuring the percentage of address points and road mileage covered by this state-of-the-art mobile broadband technology. Both of these datasets are available in a publicly viewable Google spreadsheet, with separate tabs for statewide statistics from the NBM-api and for LTE coverage by county.
Second Step: Develop Maturity Measure. Our initial thought is that an overall broadband summary metric should reflect 1) maximum advertised speeds, 2) LTE (aka 4G) mobile coverage, and, 3) the presence of competition alternatives. Maximum advertised speeds can be quantified into a metric that incorporates the percentage of households served at different max download and upload speed levels. LTE coverage can be nicely summarized by a combination of major roads and address points served. And, after looking at our options, an approach to a competition indicator could use a 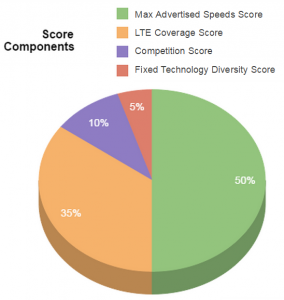 combination of number of competitors offering services (including inclusion of wireless options), and the number of methods of delivering ‘fixed’ broadband technologies. In order to create a starting point for a maturity score, we weighted the three factors (see pie chart at right). The formulas behind the measures and their weights are obviously subjective, so we kept them simple and organized the data in a spreadsheet so anyone could make their own copy and adjust the weights or even the maturity measure formulas more to reflect their own judgement. The Summary Measure Explanation section at the bottom of this post contains a more detailed descriptions of the formulas behind each measure and the total.
A perfect score using our initial crack at a metric is a very tall order, especially with much of the rural portions of the state facing difficult market challenges based on the size of their community and the distance to major metro areas and long haul fiber trunk lines. With that said, progress has consistently been made but there is still room for continued improvement.
Maximum Advertised Speed Score: This score takes the percentage of households and their highest available download and upload speeds. One point is assigned for each households served at each successive NTIA speed tier starting at 1.5 Mbps with a maximum of 8 points for 1Gb speed). Download and upload speeds are weighted equally.
LTE Coverage Score: This score takes the percentage of address points and the percentage of miles of major roads covered by LTE (mobile download 6 mbps+) and weights both addresses covered and road miles covered evenly.
Competition Score: This score takes the percentage of households that have access to 2 or more providers. The higher number of providers the higher the weight up to 4. This not a perfect measure but it reflects the expansion of provider options that has occurred in many parts of the state across the data collection rounds.
Technology Diversity Score: This score takes the percentage of households with access to different fixed broadband transmission technologies (DSL, DOCSIS 3.0 cable, fiber to the premise, and fixed wireless) and weights all 4 technologies evenly. This not a perfect measure but it reflects also reflects the technology options that have expanded across the data collection rounds.
OVERALL Weighted Score: The overall score takes each of the factors above and weights them as follows: Maximum Advertised Speed Score (50%), LTE Coverage Score (35%), Competition Score (10%), and Technology Diversity Score (5%). The latter two factors attempt to assess the options to choose from multiple broadband options, each with its own service characteristics.
Important Note: Broadband Summary Measures are only as good as the data which has been submitted over the life of the project. While most changes are due to actual increases in speed and coverage, some variation in the metrics reflects corrections to previously submitted data.