 This month, the Utah Broadband Project’s mapping team updated October 2013’s Map of the Month, which mapped the increase in maximum advertised download speeds per populated place over the course of the Project.
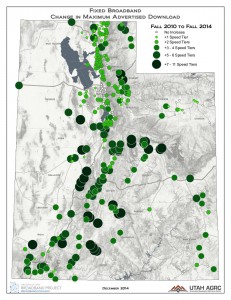
This comparison goes from Fall 2010 – Fall 2014. Fall 2010 was the first data collection round in which all of the known broadband providers participated in the mapping data collection process by providing their service areas and associated speeds and technologies. While the broadband mapping data is available down to the census block level, these maps are aggregated to the 326 cities, towns, and populated places used by the Census Bureau.
The maps show the increase over the last four years in reported maximum advertised download speeds by the change in the number of NTIA speed tier intervals. The NTIA speed tier intervals were determined at the beginning of the project to standardize speed categories nationwide. These maps only show the increase of speeds; to determine maximum advertised speeds at a specific location, visit our interactive broadband map.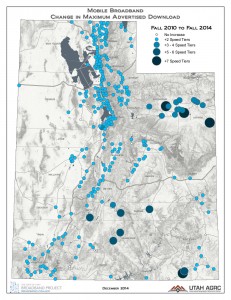
The first map (green dots), maps the maximum download speed increases advertised by fixed broadband providers. Fixed broadband providers include DSL, cable, fiber to the home, and fixed wireless. Most areas increased significantly in advertised speeds, especially in rural Utah. In some areas, such as in Salt Lake County, advertised speeds were already relatively high.
The second map (blue dots), maps the maximum download speed increases advertised by mobile broadband providers. All areas in the state have increased in mobile speeds as 3G and 4G service has become more widely available. Some areas, such as the Uintah Basin and south central Utah, saw a larger increase in mobile speeds than the rest of the state.