Click to open map of the month: tax entities density
Local and special service districts are an important user constituency for broadband services. In addition to broadband use at district headquarters, many are also dependent on broadband for field and infrastructure operations.
Open the property tax statement the county sends to property owners each summer and you’re presented with a list of local government entities, specific to your address, that are dependent on property tax levies for their infrastructure and operational costs. Some of the entities should be quite familiar to you—your county, your school district, and the city you live in—but you may not necessarily be on a first name basis with the others.
The March 2017 Map of the Month showcases Utah’s 800+ local, special service, redevelopment, and other taxing districts that provide specific services such as fire protection, water, sewer and sanitation services, animal control, libraries, revitalization, recreation, mosquito abatement, and even cemetery maintenance. When combined with Utah’s counties, cities, and school districts, the state has over 1100 formal political subdivisions. And, that’s before counting a few more that subside solely from fee-based funding.
For redevelopment districts, broadband speed and capacity no doubt play an important role in attracting the desired levels of economic development and business recruitment/retention.
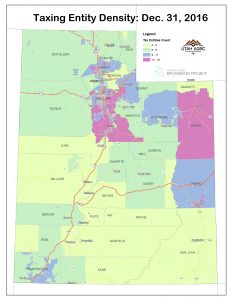
The density of local taxing districts varies across the state (see map above). This variance is largely due to the funding model with which municipal-type services are delivered in different areas. For example, some counties and cities may provide animal control services from their general fund while this type of service may be delivered by a separately incorporated local district elsewhere, that may include several cities and even some unincorporated areas. Different local approaches determine whether fire protection, flood control, libraries, recreation programs, and other service result in the creation of a separate district or not.
While the boundaries of these districts may change throughout the year through incorporations, annexations, and dissolutions, the annual list and map layers are published on an annual cycle, based on a snapshot taken at the end of the previous year.
County government compiles the boundaries of local taxing districts annually in order to ensure the aforementioned property tax statements are correct for each owner of traditional parcel-style properties. And, at the state level, the Property Tax Division of the Utah State Tax Commission maintains a statewide set of district boundaries, as it has responsibilities for tax assessment of non-traditional properties that include fiber optic and other broadband lines, other telecommunications infrastructure, electrical transmission lines, air terminal equipment, and surface mining operations like gravel pits.
 Them Dec 31, 2016 list of local tax districts with detailed information is available to the public on this open data page. On this website, you can interact with list and map data in several ways, including:
- To filter the dataset, click the filtering icon (looks like a funnel) next to the column header that you wish to filter by. Then, click the drop-down menu that appears at the top of the table (see screenshot).
- You can also sort by a column by clicking on the header, and then the triangle in the bottom right of the column header.
- To get information on individual tax districts from the map, click on an area and a pop-up will open. Since there is more than one district at any location, you can click on a “next” triangle in the upper right corner of the pop-up window to view each district individually.
The taxing districts dataset is also available for download from the open data page in multiple formats, including excel spreadsheet, and mapping files such as shapefile and KML. Look for the ‘Download Data’ button above the right side of the table. Note that only local tax districts are included in this particular dataset — counties, cities, towns and school districts are excluded.