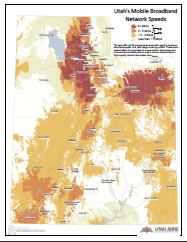
The sixth installment in our Map of the Month series…
The availability of broadband via mobile wireless services is extremely important for economic activity, public safety, recreation, and just plain old convenience. Coverage is now widely expected in urban areas, along major transportation corridors, and anywhere you’re likely to find people in significant numbers.
While basic coverage is important for voice and text services, more users are requiring or demanding faster mobile broadband speeds for streaming video, mapping applications, photo up/download, and other bandwidth intensive services. And, in response, the capabilities of the core technologies and the offerings of the mobile providers are improving rapidly.
This month’s map shows the maximum advertised download speeds for mobile broadband across the state, using the speed range classes established for the NTIA’s State Broadband Initiative which collects data to feed into the FCC’s National Broadband Map. The terms 3G and 4G do not translate to exact speeds (the ‘G’ just stands for ‘generation’ and the implied speed varies by provider). Because of this, map legend includes a graphic indicating the approximate speed ranges for what is being billed at 3G and 4G. Keep in mind these are maximum advertised speeds and your experience, at any given time, will depend on the technology in place and the volume of traffic being handled by the cell towers.
Utah and other states will soon begin to plan for their part in the National Public Safety Broadband Network (NPSBN), a dedicated 4G LTE mobile network prioritized for use by public safety, being overseen by the newly established FirstNet Board of Directors. As this network is highly likely to include portions of the existing commercial providers’ networks, knowing where 4G coverage is available is a very important input into the planning process.
The data shown on the map is the most recent data provided to the Utah Broadband Project (UBP) and reflects services in place on or after July 1, 2012 and through Oct 1, 2012. The data does not show individual providers speeds but these can be viewed on UBP’s Interactive Map by using the Data Filter’s Providers option (found on the right side of that page).
