

 Our September map of the month revisits a topic that we explored in October of 2014 — how Utah’s broadband coverage is overrepresented in the Federal Communications Commission’s (FCC) Form 477 broadband maps. This is a policy issue and one that certainly impacts most if not all states.
The overrepresentation is due to the FCC’s current map specification that relies on census blocks as the geographic reporting units for all ‘fixed’ (non-mobile) broadband technologies. The effect is especially prominent on the periphery of Utah’s rural communities. And, given the nature and detail of the questions relating to broadband mapping that were posed in the FCC’s recent Further Notice of Propose Rulemaking for Form 477, it seems that the FCC is also aware of the inherent limitations with their current approach.
This map granularity issue is quite important, especially when it comes to closing the gap on un- and under-served rural areas. Similar to solving for rural electrification decades ago, with rural broadband, you have to know where the proverbial last farmhouse is and whether it actually has service. It is must less valuable to know it is close to some service. Almost doesn’t really count.
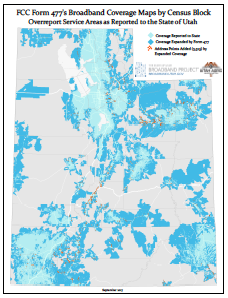
We’ll start off with a view of the overall expanded ‘coverage’ across all fixed broadband technologies (wireline + fixed wireless), that stems from the use of census blocks, nationwide as FCC’s reporting unit. This map (above, right) shows the broadband coverage reported to the Broadband Outreach Center this Fall in light blue. This is what is featured on the Utah Residential Broadband interactive map. The darker blue areas are the expanded coverage area created when the more precise data is converted to the Form 477 census blocks using the proscribed principle that if any portion of the census block is covered, the whole area is counted as served.
We’ve obviously got some large census blocks in rural Utah. Lastly, the red dots on the maps are addressed properties in the expanded coverage area, that are likely not yet served, but appear to be when looking at the data as requested by the FCC.
Quoting from our October 2014 post, “it is important to remember that the two data formats represent the exact same broadband coverage in the physical world, they just employ a different level of granularity.” And, the differences have nothing to do with what the providers are reporting, but how they are asked to report by the FCC.
It’s also useful to recall that the National Telecommunications and Information Agency (NTIA) mapping specifications in use from 2010 to 2014 did not have as large an overstatement of coverage issue. This was because the NTIA specs expressed broadband service along road segments in rural areas where the census blocks are greater than two square miles. Not perfect, but better than the current Form 477 approach.
The maps below compare, for each fixed broadband technology, the data received by the Utah Broadband Outreach Center (lighter colors) and the expansion of the same physical coverage (darker colors) due to conversion to the FCC Form 477 specifications.
 , opens in a new tab
 , opens in a new tab
 , opens in a new tab
 , opens in a new tab
In conclusion, it will be very interesting to see what feedback the FCC receives and acts upon in response to its request for public comment on Form 477 broadband mapping methods. In general, more granular mapping approaches to broadband — that represent actual, physical coverage, or exacting locations of under- and un-served residential and commercial locations — are what’s needed to best inform the important work done to finish connecting our country to critical broadband services. It’s hard to imagine that work being done optimally without more precise coverage maps. Stay tuned.