

The 2018 general session of the Legislature kicks off on Monday, January 22nd so, our January 2018 Map of the Month, has an appropriate theme. This month, we’re taking a quick look at the distribution of residential broadband providers across Utah’s 104 state legislative districts. To do this we’ve overlaid the map coverage data provided by Utah broadband companies with the state’s House and Senate political district data.
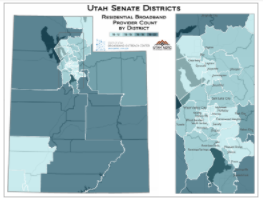
Residential Provider Count, Utah Senate Districts
At first, the results are a bit surprising as most of Utah’s 75 State House of Representatives and 29 State Senate districts have what may seem like a large number of broadband providers serving potions of their district’s constituents. House Districts average 11.6 broadband providers serving at least part of their district. Senate districts average 13.3 providers. Here’s a list of the residential broadband providers for each district.
Several factors are at play to produce larger numbers than what might be expected. First and foremost, there are numerous types of broadband services marketed to consumers, and we’ve lumped them all together for this analysis, including the four national mobile providers, fixed wireless providers, and cable, DSL, and fiber landline providers. And, it makes sense that for specific locations in Utah’s larger urban markets, there’s going to be a number of providers and technology types to choose from.
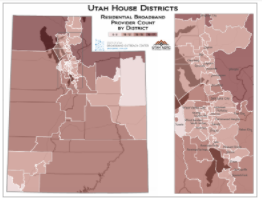
Residential Provider Count, Utah House Districts
But what about rural areas? Because House and Senate districts are balanced for population when they are redrawn every 10 years, that means that districts in rural areas are quite large and can span many counties and even more communities. That means most rural legislative districts have multiple rural telecom providers in addition to mobile broadband and even small-area fixed wireless providers. Remember also that for this analysis, serving just a portion of the district is counted the same as serving a large portion.
For more details, the Utah Residential Broadband Map can be consulted to:
- see the coverage footprints for specific providers (use the Provider Filter), and
- zoom to specific Legislative districts (for example, type Sen 13 or Rep 68 into the box in the upper corner of the map portion of the site.
Greater geographic size also explains why Senate districts, representing about 100,000 residents per district, average a few more broadband providers with service offerings within their boundaries than House Districts, which represent, on average about 40,000 residents each.
The task of keeping up-to-speed with business activity and constituent issues in general has gotta be just plain harder for rural legislators — you’ve got the same number of constituents, and, judging from the broadband data, probably about the similar number of businesses in your district. But everything, is much farther apart, and likely farther from your home base. Hats off to all our state legislators for their service, but especially to those who make the longest trips to the capital city, and those with the largest districts, geographically speaking.